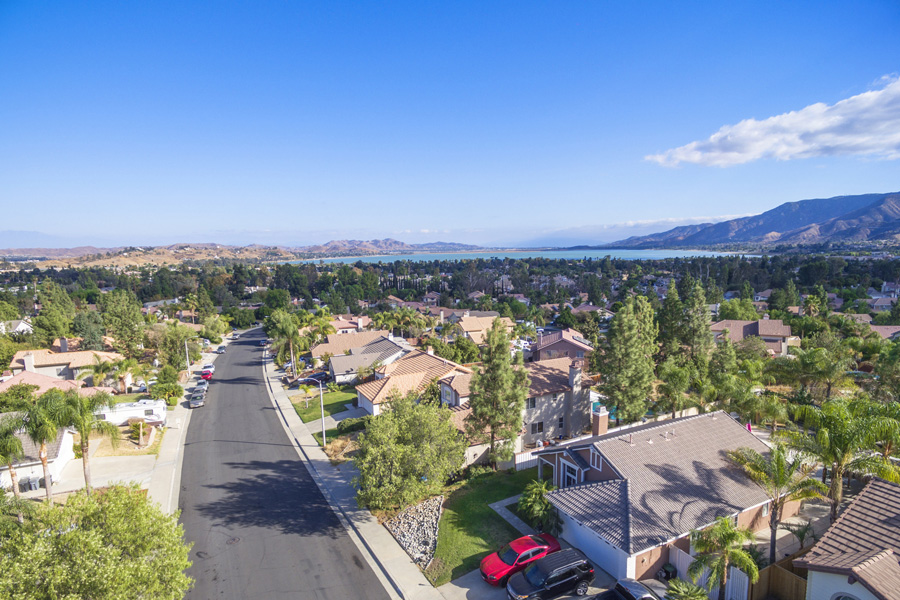
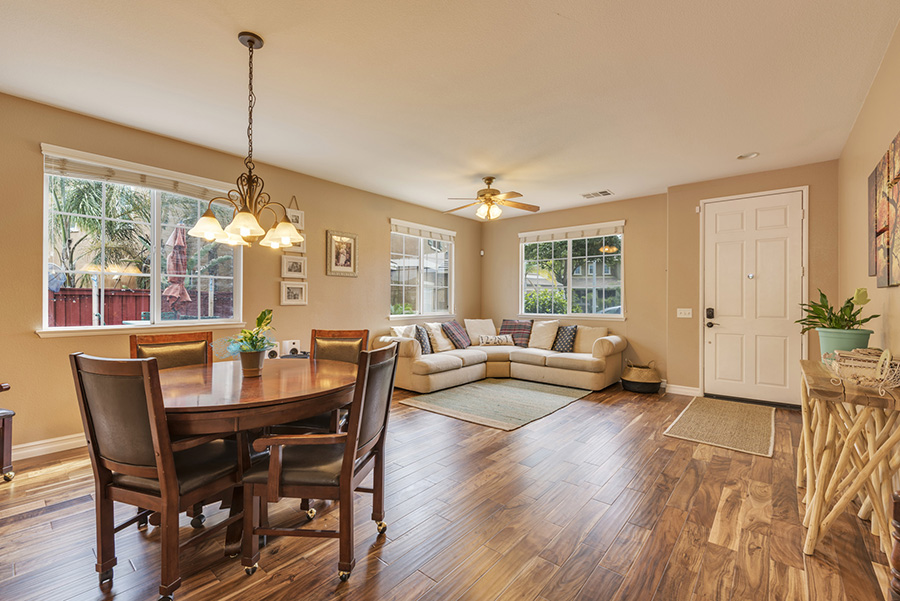
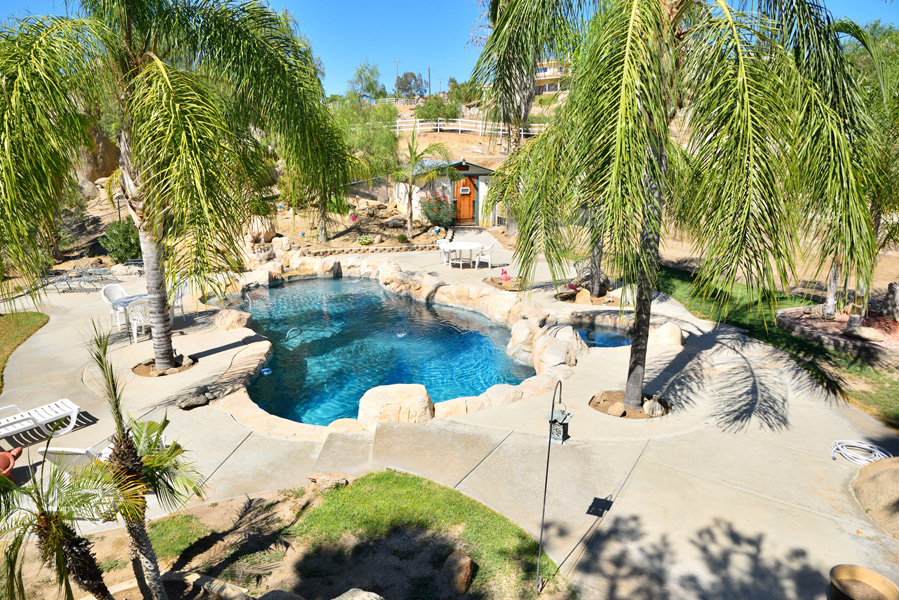
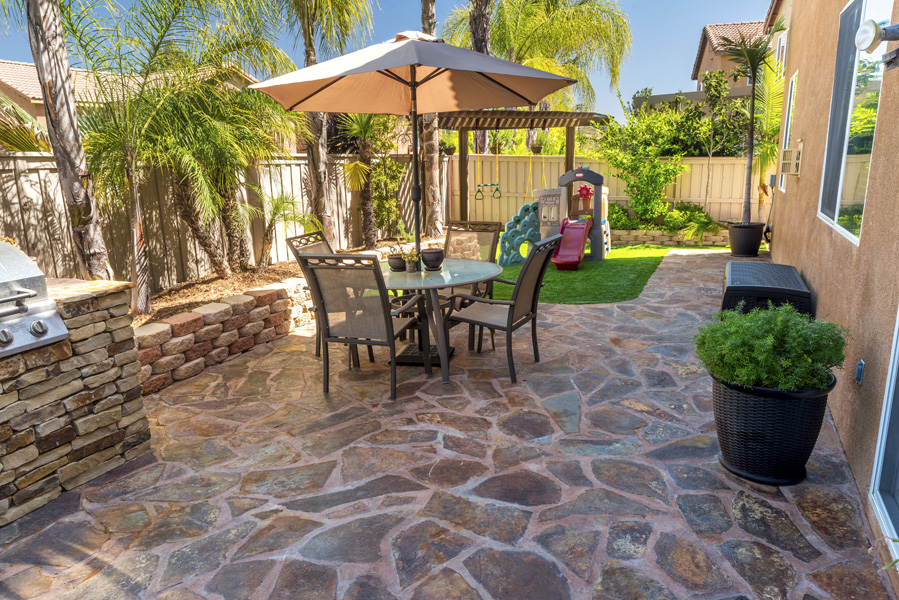
Gallery 2018

Pansy-WaySilver-Oak-CirOviedo-StEl-PresidioCottage-CtChamomile-StWoodruffStage-Coach-RdCamelinaRim Creek PathagaveKlamathTwilightVistaAmypanterat1 00 Buckboard 001 - Cartier 002 - Lantana 003 - Apache Hill 04 Canopy 05 Kennedy 06 Frederick 07 Ironwood 08 Parkview 08-2 Vista Loreta 08-3 08-4 08-5 009 010 011 012 013 014 015 016 017 018 019 020 021 022 023t2 024 025 026 027 028 029

sharpe sorrel townsend willow pool 080 081

Sean Oneil Reviews

This page has moved, please click here to be redirected to the new location: www.OneilRealty.com/testimonials

Sean Oneil Zillow Realtor

This page has moved, please click here to be redirected to the new location: www.OneilRealty.com

Sean Oneil Real Estate

This page has moved, please click here to be redirected to the new location: www.OneilRealty.com

What’s Your Home Worth?


Value

Current Market Update

Current Market Update

graphs

  • Existing home sales hit a ten-year high in March, with an annual rate of 5.71 million units sold. For the full year, 5.45 million homes were sold in 2016. Sales in the first quarter of 2017 were up 5.1% over sales during last year’s first quarter.1


  • The median price of existing homes sold in March was $236,400, up 6.8% from the median price in March 2016. Half of the properties sold in March were on the market for 34 days or fewer, down from a median of 47 days on the market a year earlier.1


  • New home sales rose 5.8% in March to an annualized rate of 621,000 units. That’s the second-fastest pace recorded since early 2008. Sales during the first quarter of 2017 are up 11.2% over sales during the first quarter of 2016.2


  • The median price of new homes sold in March was $315,100, up 1.2% from the median price in March 2016.2


  • The economic expansion slowed during the first quarter of 2017, as GDP rose at a 0.7% annualized rate. That’s down from the 2.8% annualized growth rate in 2016’s second half.3


  • The number of hours worked rose 1.6% during the first quarter while output rose 1.0%. That resulted in a 0.6% decline in productivity, or output per hour worked. Productivity has fallen in four of the past six quarters. Over the past two years, productivity has grown at a 0.6% average annual rate, compared to a 2.0% average over the past 20 years.4


  • The homeownership rate was 63.6% in the first quarter, up from 63.5% in the fourth quarter. A year ago, the rate was also 63.5%. In the second quarter of 2016, the homeownership rate was 63.2%, its lowest level since the 1960s.5


  • The average rate on 30-year fixed-rate mortgages in Freddie Mac’s survey was 4.02% during the week ending May 4, down 1 basis point from the week before. The April average was 4.05%, and the March average was 4.20%. All rates quoted have fees and points averaging 0.4% to 0.5% of the loan amount.6


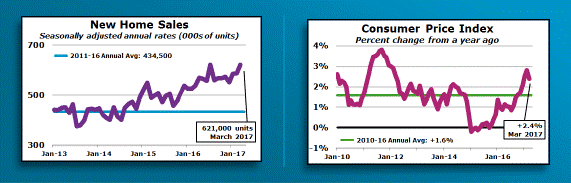
1. “Existing-Home Sales Jumped 4.4% in March,” National Association of Realtors®, April 21, 2017. All sales data are seasonally adjusted; price and days on market are not. www.nar.realtor/news-releases/2017/04/existing-home-sales-jumped-44-in-march
2. “New Residential Sales, March 2017,” Census Bureau, April 25, 2017. www.census.gov/construction/nrs/pdf/newressales_201703.pdf.
3. “National Income and Product Accounts – GDP First Quarter 2017 (Advance Estimate),” Bureau of Economic Analysis, Department of Commerce, April 28, 2017. www.bea.gov/newsreleases/national/gdp/2017/gdp1q17_adv.htm
4. “Productivity and Costs, First Quarter 2017 – Preliminary,” Bureau of Labor Statistics, Department of Labor, May 4, 2017. Data reflect the nonfarm business sector.
www.bls.gov/news.release/prod2.nr0.htm
5. “Quarterly Residential Vacancies and Homeownership, First Quarter 2017,” U.S. Census Bureau, April 27, 2017. Homeownership data are seasonally adjusted.
www.census.gov/housing/hvs/data/q117ind.html
6. Freddie Mac Primary Mortgage Market Survey, May 4, 2017.
www.freddiemac.com/pmms/.
The FRB of St Louis Economic Data system (FRED) was used to collect data on existing home sales and prices, new home sales and prices, GDP, productivity, and homeownership.

Southern California Market Update – Feb 2017

Southern California Market Update – Feb 2017


February Home Sales Dip Year Over Year Across Most of Southern California; Median Sale Price Up Modestly Month Over Month and Up 7 Percent Year Over Year. New data released by CoreLogic® shows a total of 14,891 new and resale houses and condos sold in February 2017 in Los Angeles, Riverside, San Diego, Ventura, San Bernardino and Orange counties, down 3.4 percent month over month from 15,422 sales in January 2017* and down 1.7 percent year over year from 15,149 sales in February 2016.


The average change in sales between January and February is a gain of 0.7 percent. February sales have ranged from a low of 10,777 in 2008 to a high of 26,587 in 2004, and February 2017 sales were 13.5 percent below the February average of 17,215 sales since 1988 when data for this report begins (data start dates vary by county).


In February 2017, sales of newly built homes—detached houses and condos combined—were about 50 percent below the long-term February average. The resale market, however, is closer to its historical average with February 2017 resales coming in about 7.6 percent below the February average. Ignoring the 2003-2006 housing boom that was fueled by risky home loans, February 2017 resales were 4 percent below the month’s average. “Southern California’s February home sales fell a little from a year earlier; however, a closer analysis suggests demand was roughly flat – or even up a bit – from a year earlier,” said Andrew LePage, research analyst with CoreLogic. “That’s because this February had one less business day on which deals could be recorded, and the average number of transactions recorded daily was slightly higher compared with February 2016. Regardless, February 2017 home sales were about 14 percent below the average February sales tally over the last 30 years. Activity continues to be constrained by the decline in affordability and the relatively thin inventory of homes for sale. San Bernardino County, which has the region’s lowest median sale price and entices many first-time buyers and others priced out of coastal markets, was the only Southern California county to post a year-over-year increase in sales this February.”


The median price paid for all Southern California homes sold in February 2017 was $460,000 which is up 1.1 percent month over month from $455,000 in January 2017* and up 7 percent year over year from $430,000 in February 2016. The February 2017 median was 8.9 percent below the peak median of $505,000 reached in March, April, May and July of 2007; however, when the median sale price history is adjusted for inflation, the February 2017 median remained 19.5 percent below the peak. “All of the region’s counties saw a higher year-over-year increase in their median sale price in February compared with the prior month,” said LePage. “The regional median’s 7 percent year-over-year gain in February was the highest in 15 months, and exceeded the average year-over-year gain of 5.8 percent over the past 24 months. However, January and February sales data usually aren’t predictive, and if mortgage rates continue to increase it will be more difficult for home prices to rise as fast.


Mortgage rates are nearly impossible to predict, but there are signs, such as continued job growth and a pickup in inflation, that
they are likely to edge higher this year.” Home sales of $500,000 or more accounted for 44.2 percent of all sales in February 2017, up from 43.9 percent in January 2016 and up from 39.2 percent in February 2016. The number of homes that sold for $500,000 or more in February 2017 rose 11 percent compared with February 2016 and sales below $500,000 fell 9.7 percent over the same period. Sales of $800,000 or more
increased 10.5 percent year over year and sales of $1 million or more increased 14.1 percent. At the other end of the market, sales below $200,000 fell 23.5 percent in February 2017. Additional Southern California Highlights for February 2017:


Southern Californians took out approximately 5,300 home equity lines of credit (HELOCs) in February 2017. This was down about
18 percent from January 2017 and down about 6 percent from February 2016. The approximately 17,700 HELOCs originated in the
region in the three months ending in February 2017 fell about 1 percent from the same three-month period a year earlier. However,
there’s been a substantial gain in another method of tapping home equity: The number of cash-out refinances between December
2016 and February 2017 increased about 28 percent year over year.


Absentee buyers, mostly investors and some vacation-home buyers, bought 24 percent of all homes sold in February 2017. This is
up from 22.5 percent in January 2017 and down a hair from 24.2 percent in February 2016. The absentee share peaked in February
2013 at 32.2 percent, and the monthly average since 1988 is approximately 18 percent.
Cash buyers accounted for 25.8 percent of February 2017 home sales, up from 22.2 percent in January 2017 and up slightly from
25 percent in February 2016. The cash sales share peaked in February 2013 at 37.5 percent, and the monthly average since 1988 is
about 16 percent.
Jumbo mortgages accounted for 13.6 percent of the total number of home purchase loans used in Southern California in February
2017, down from 13.8 percent in January 2017 and up from 13.2 percent in February 2016. Jumbo loans represented 31.9 percent
of the total dollar volume of all home purchase originations in February 2017, down from 32.2 percent in January 2017 and up
from 29.8 percent in February 2016. Southern California’s jumbo share of all home purchase loan dollars peaked last year in June
at 34.3 percent. Jumbo loans are those that exceed the “conforming loan limit” which is set by regulation and varies by county.
Nationally, the base conforming loan limit for single-family homes this year is $424,100, but high-cost counties including San
Diego, Orange, Los Angeles and Ventura have higher limits of up to $636,150. A rise in the jumbo loan share of home purchase
loans can be related to higher home prices, an increase in the share of sales occurring in the market’s higher end, or greater
availability of funding for jumbo loans.
Government-insured, low-down-payment Federal Housing Administration (FHA) loans accounted for one out of every five
(20 percent) home purchase loans in Southern California in Februay 2017, down slightly from 20.3 percent in January 2017 and
down from 21.9 percent in February 2016. Riverside and San Bernardino counties experienced the region’s highest FHA share in
February of this year at 28.5 percent and 33.2 percent, respectively.
Real estate-owned (REO) sales represented 3 percent of total Southern California home sales in February 2017, down from
3.4 percent in January 2017* and down from 4.4 percent in February 2016. REOs are homes that lenders took back through
foreclosure and then sold on the open market.
* When necessary, January 2017 data was revised. Revisions are standard, and to ensure accuracy CoreLogic incorporates newly released data to provide updated results. Source: CoreLogic.

The Oasis – Menifee

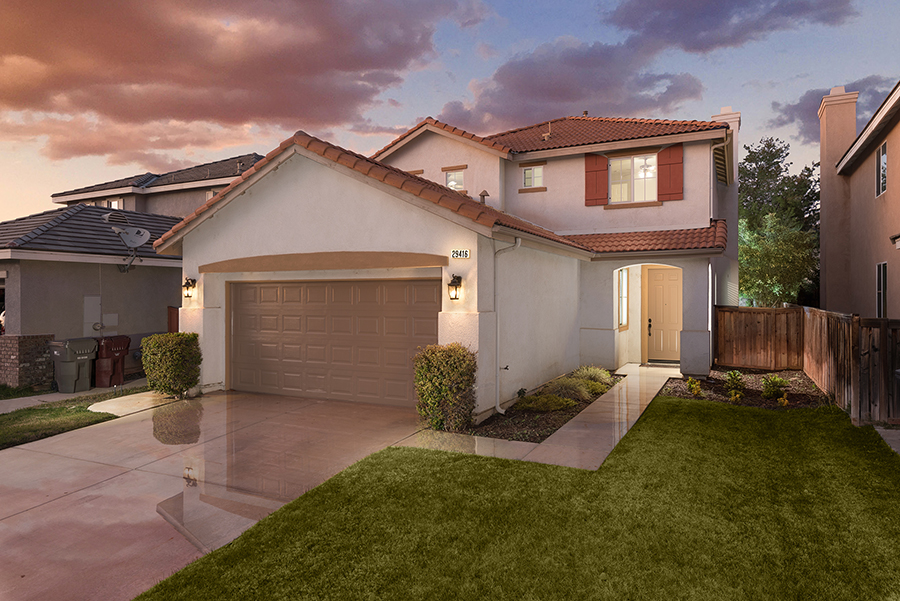
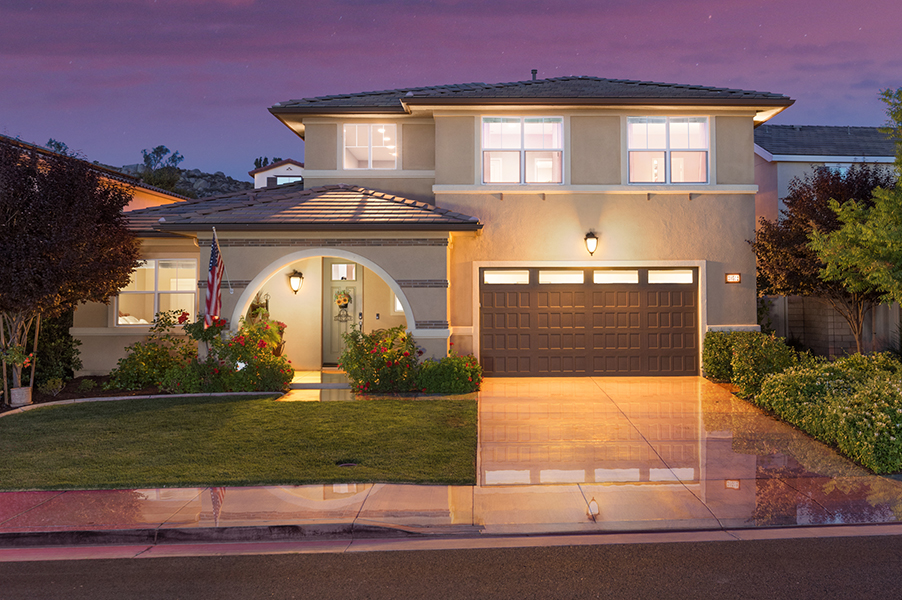
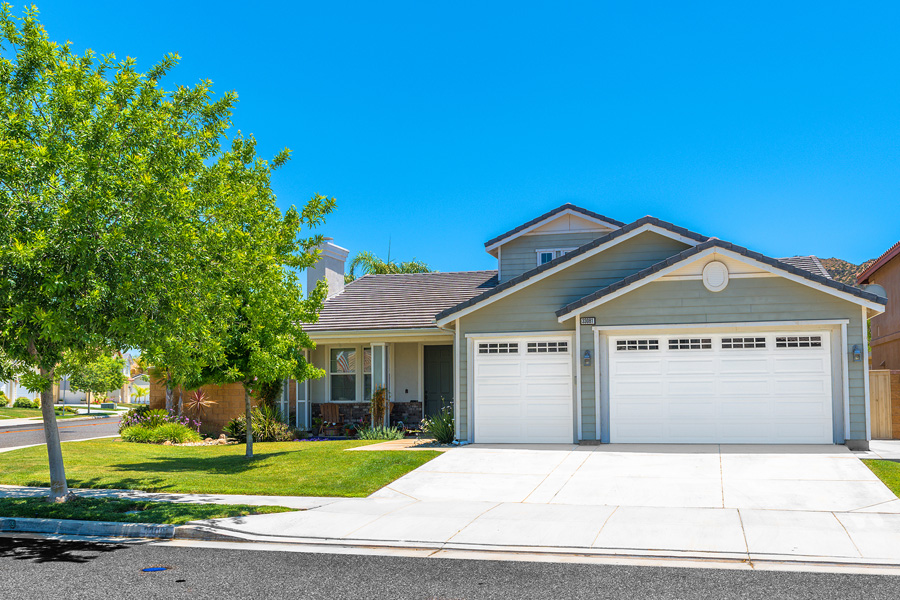
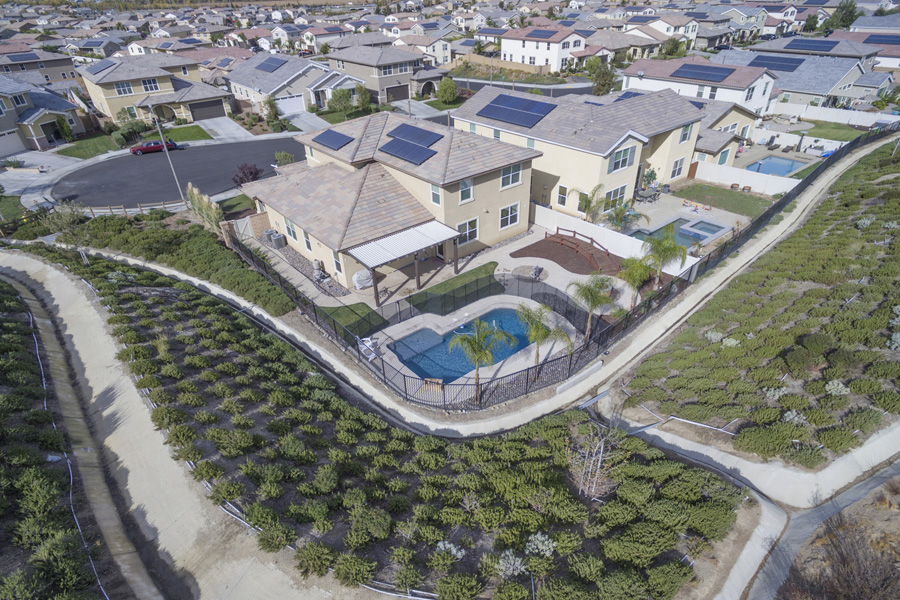
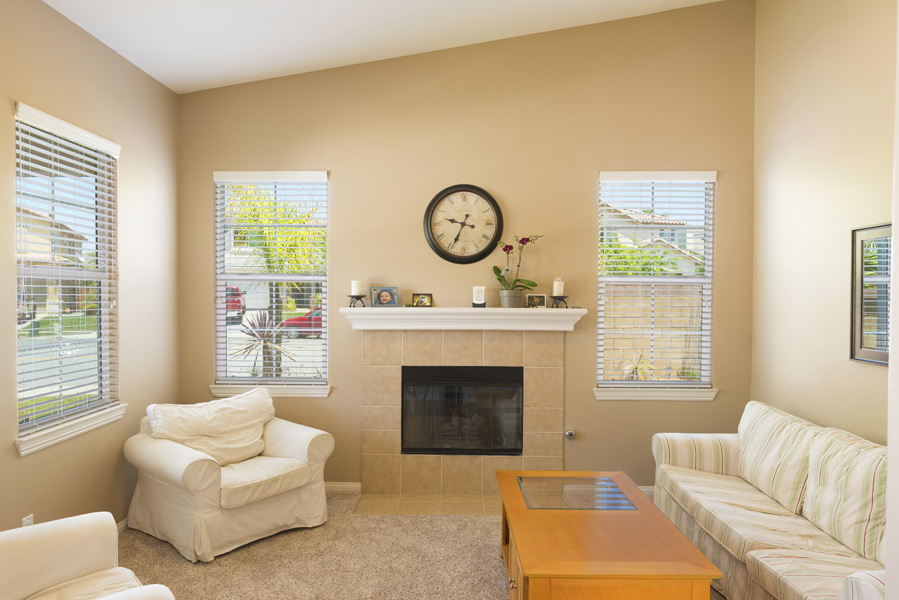
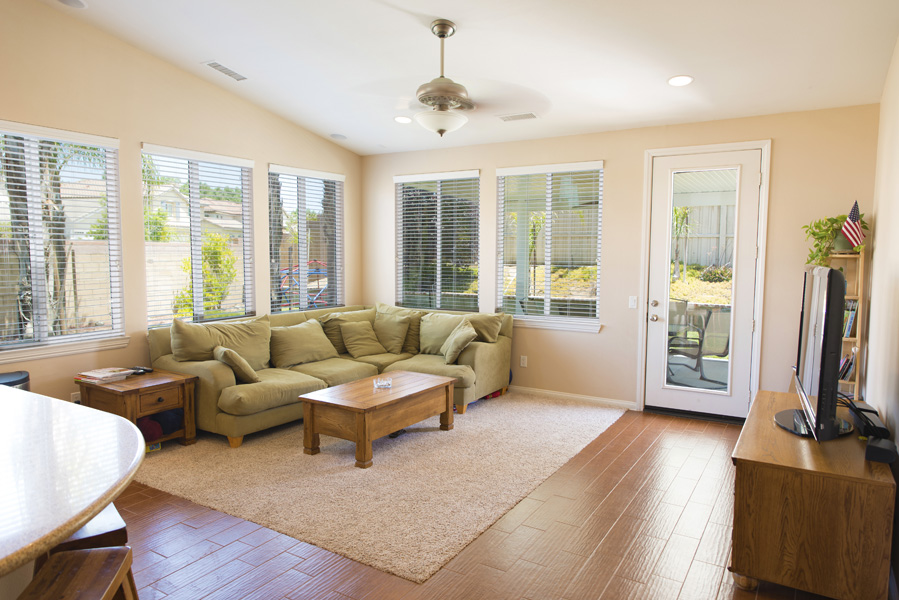
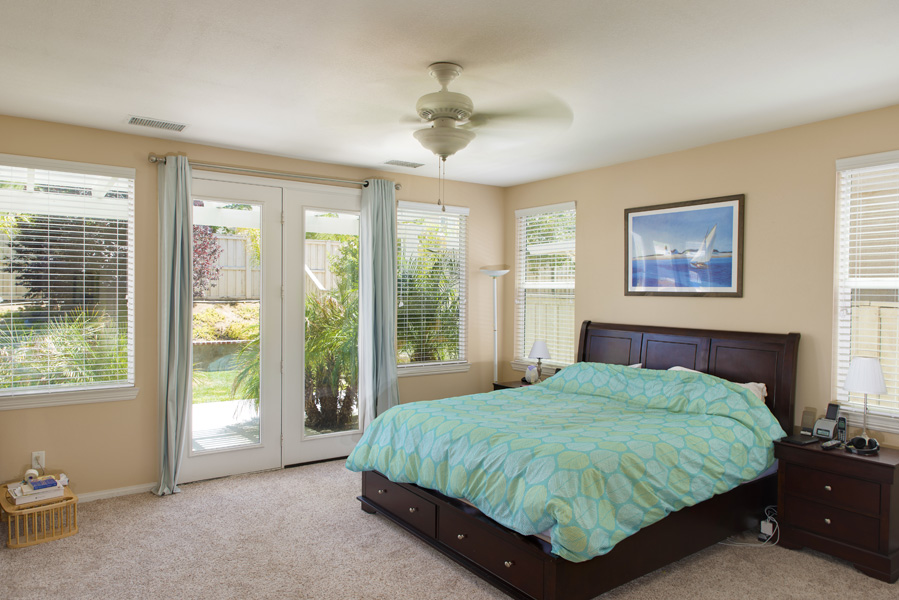
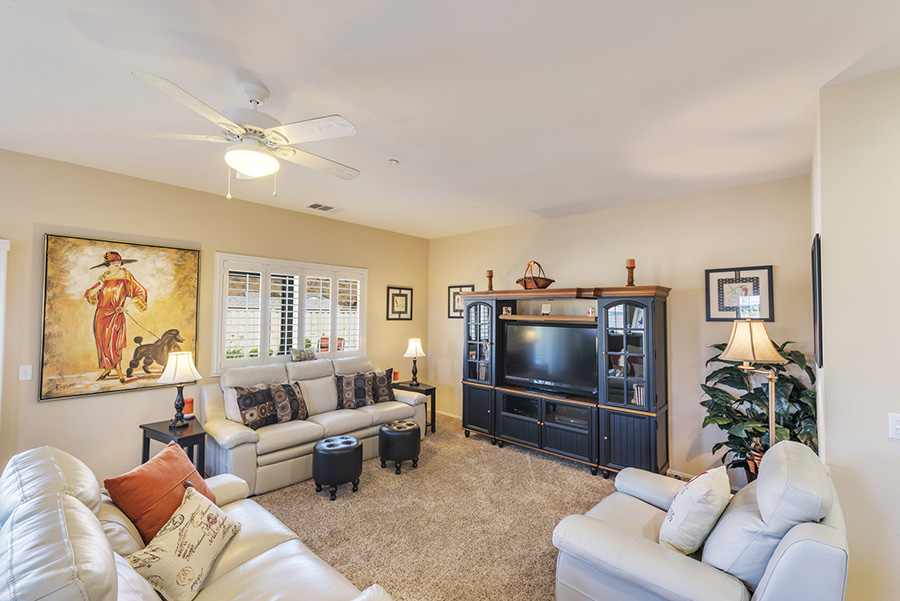
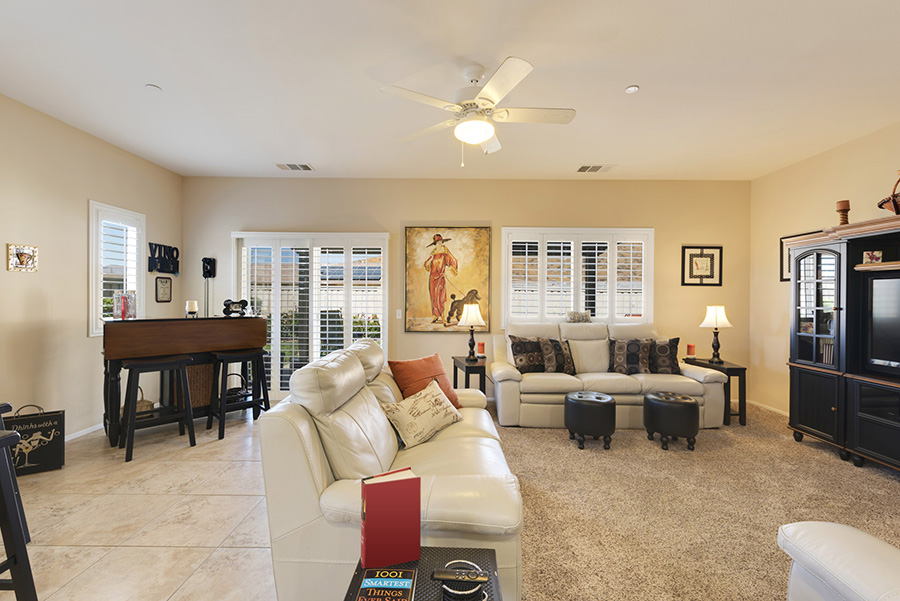
The Oasis – Menifee – Homes For Sale

This is a gated golf course community for residents age 55+ only

Click on any home below for info:

Audie Murphy Ranch – Menifee

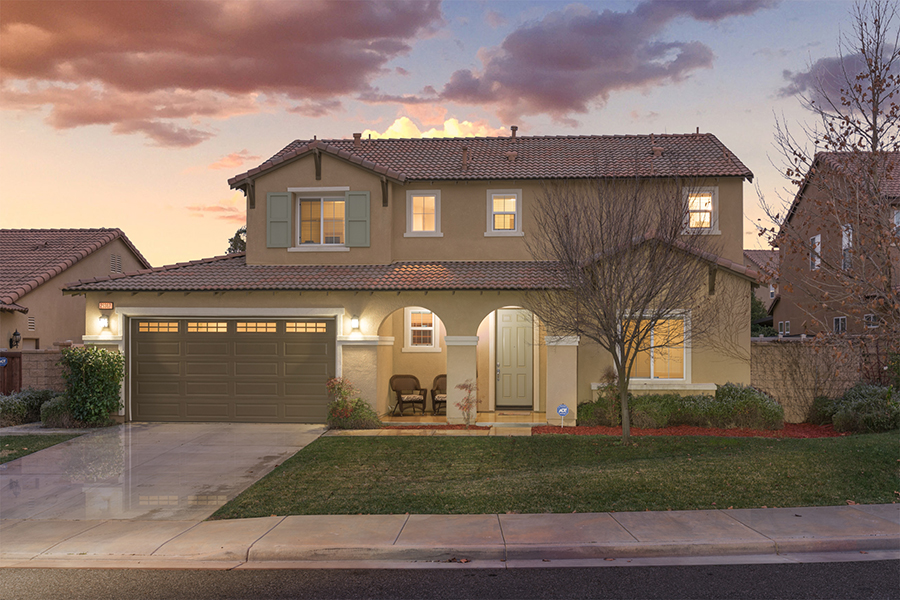
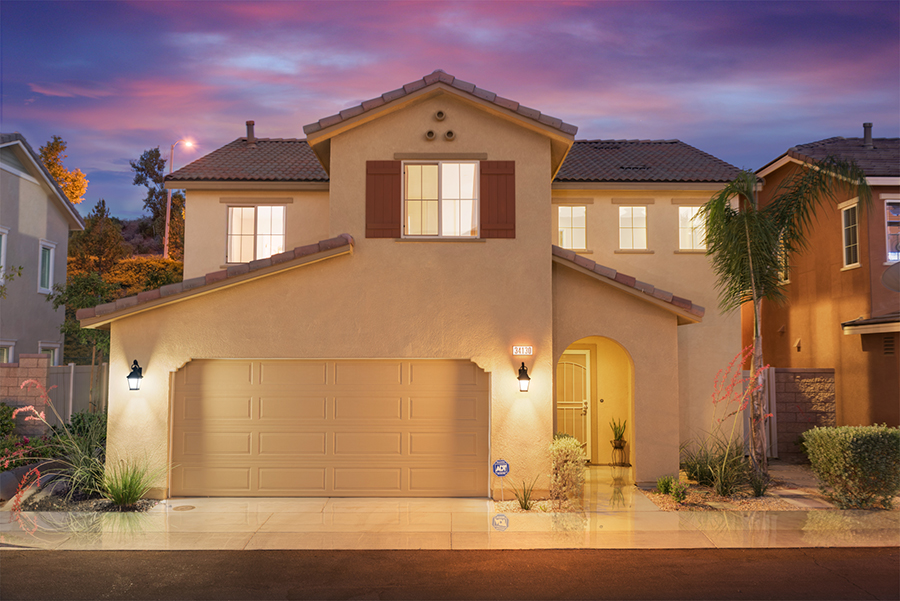
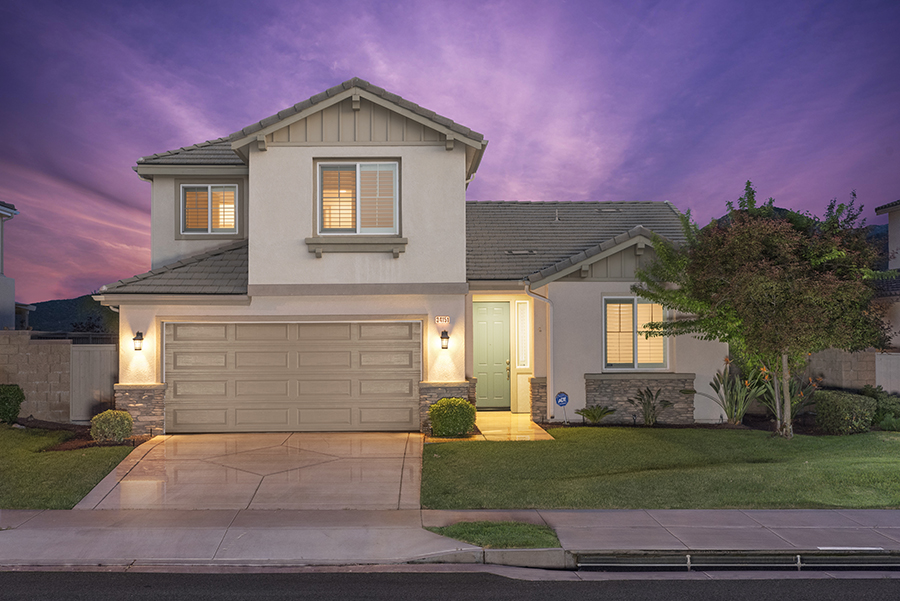
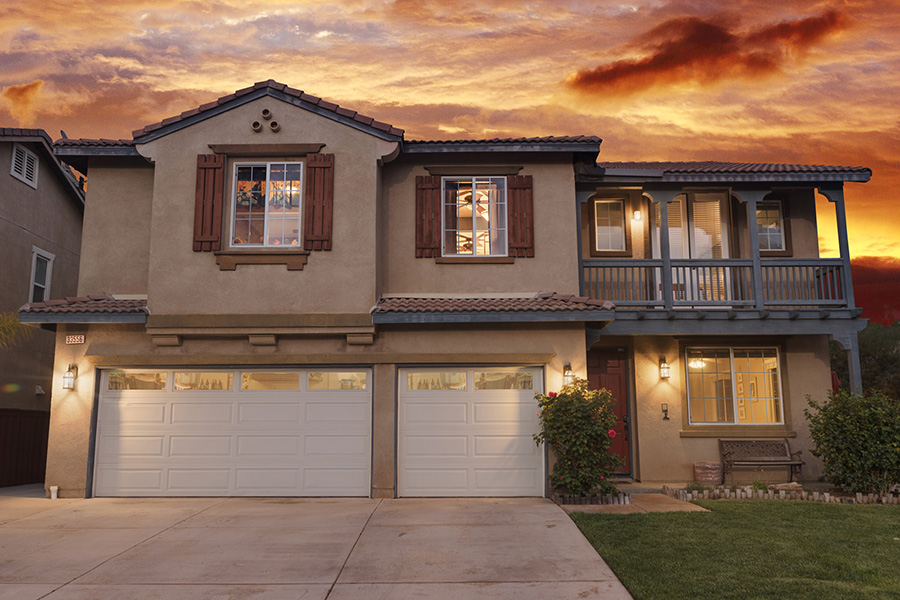
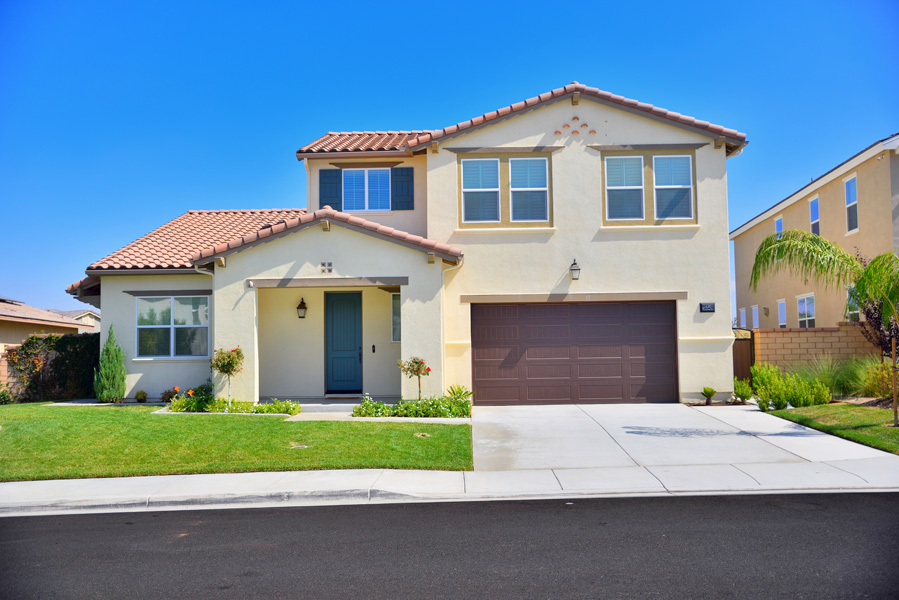
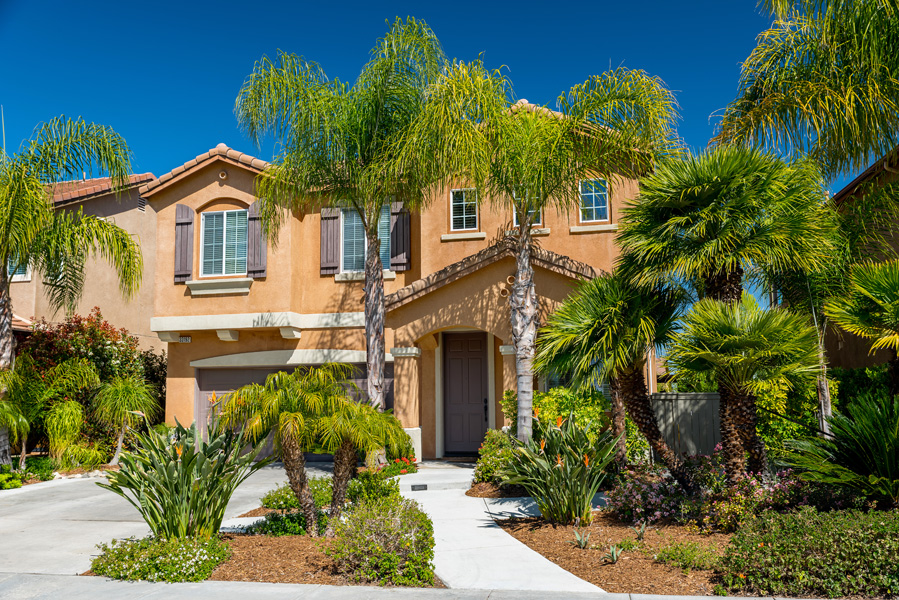
Audie Murphy Ranch – Menifee – Homes For Sale

Click on any home below for more info or call Sean O’Neil at (951) 285-6777

North Shore – Lake Elsinore

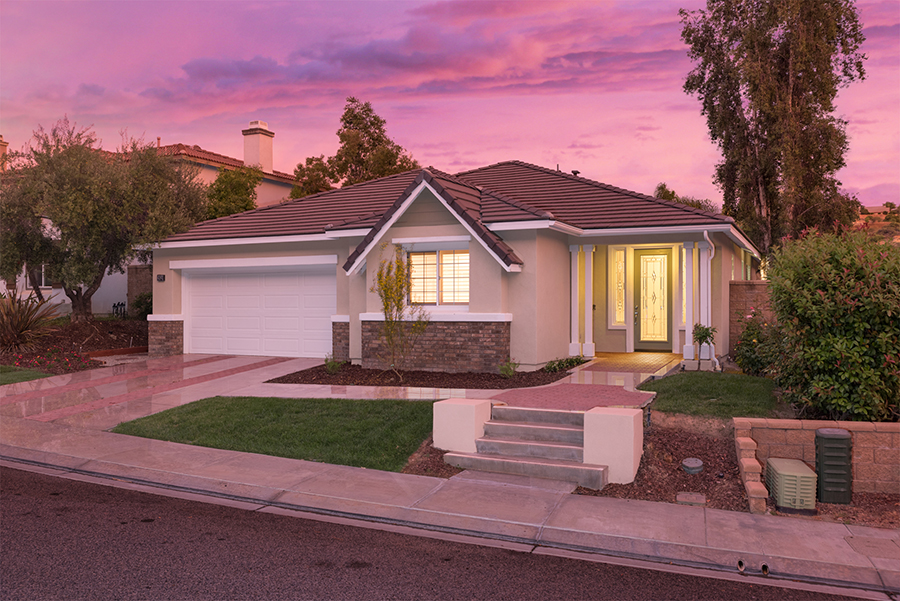
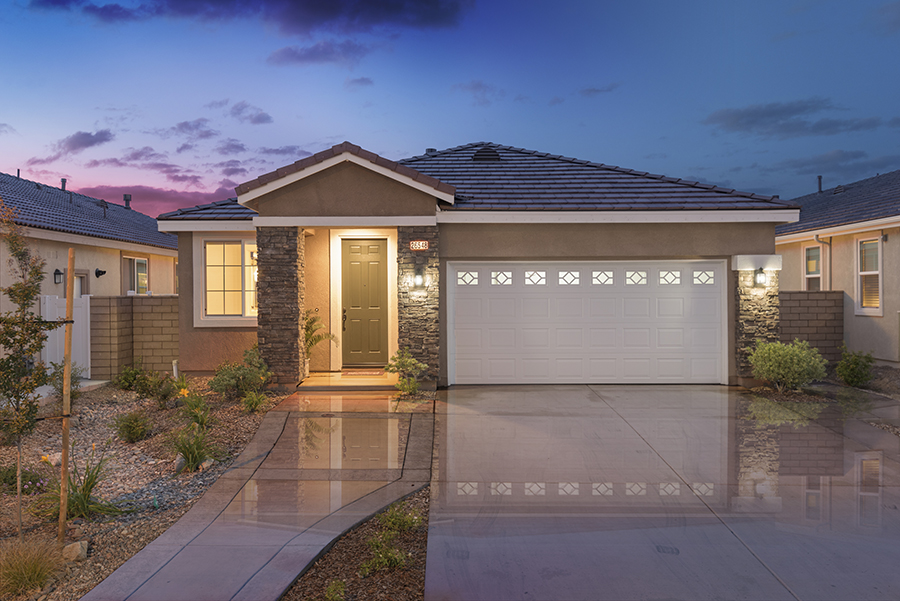
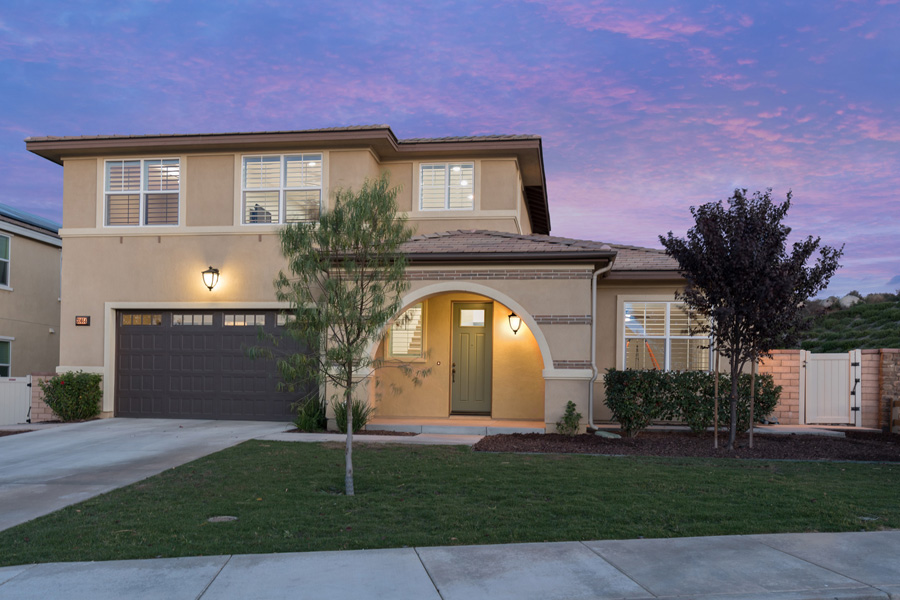
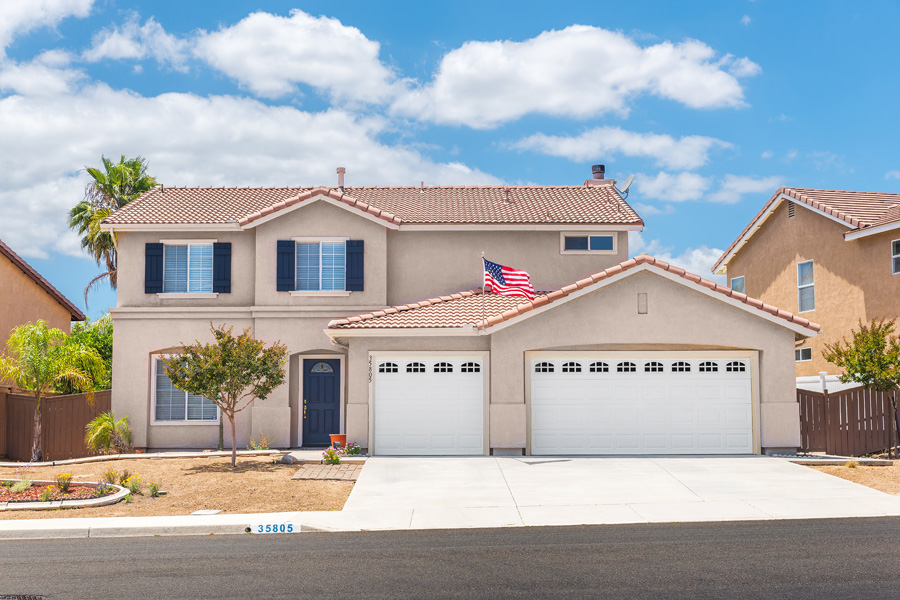
North Shore – Lake Elsinore – Homes For Sale

Click on any home below for more info or call Sean O’Neil at (951) 285-6777